- Bitcoin fell below $80,000 on Monday, dropping as low as $75,644 as it broke under its 21-week moving average—a key technical level that often signals a bear market.
- Over $2.5 billion in liquidations hammered the market over the weekend, making it the 10th-largest wipeout in history as Bitcoin fell 17% from its $90,000 January highs.
- $1.82 billion exited spot ETFs in just five days, marking a massive sentiment shift from mid-January when the market saw record-breaking inflows.
Bitcoin (BTC) held below US$80,000 (AU$122,400) on Monday after a more than 6% slide the previous day, with data from ETFs, derivatives, and on-chain metrics pointing to a move driven by leverage and thinning liquidity.
On the weekly chart, BTC has lost the 21-week exponential moving average, a level whose breakdown preceded earlier bear markets.
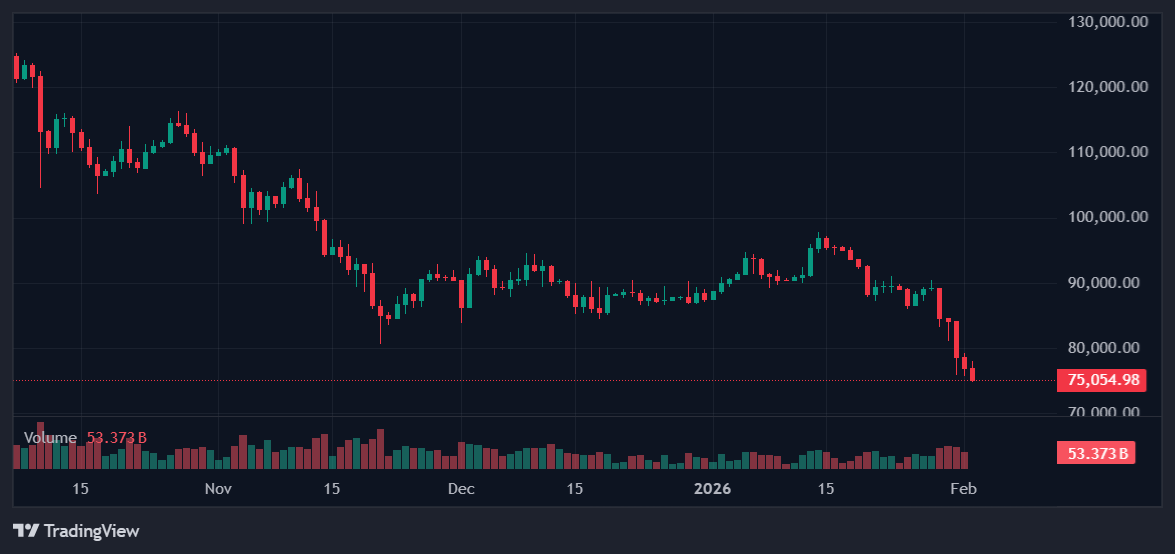
Analyst Rekt Capital noted that BTC has already fallen about 17% from roughly US$90,000 (AU$137,700) to US$78,000 (AU$119,340) since the latest bull-market EMA crossover:
So far, history is repeating, with downside occurring after the Bull Market EMA crossover. Bitcoin has dropped -17% from $90,000 to $78,000 since the crossover took place. History suggests that additional downside continuation over time lays ahead.
 Rekt Capital
 To make matters worse, CryptoBullet pointed to Bitcoin’s drop below the 21-week exponential moving average, a breakdown that preceded earlier bear markets.
Looking at on-chain data, CryptoQuant data shows spot trading below the realised price for holders who last moved coins 12–18 months ago, meaning this cohort is now underwater.
Related: SEC Chair Walks Back Timeline on Sweeping Crypto Exemptions After Wall Street Pushback
Liquidity Squeeze And Forced Selling
Unsurprisingly, US-listed spot Bitcoin and Ether ETFs saw steady outflows, as investors withdrew about US$1.82 billion (AU$2.78 billion) from spot crypto ETFs over five trading days, including roughly US$1.49 billion (AU$2.28 billion) from Bitcoin products and US$327 million (AU$500 million) from Ether funds.
The redemptions reversed a brief spike in demand in mid-January, when Bitcoin rose around 7% in two days and spot Bitcoin ETFs booked their largest single-day inflow of 2026 at US$840.6 million (AU$1.29 billion), alongside a jump in the Crypto Fear & Greed Index.
Analysts are pointed to three rapid liquidation waves totaling about US$1.3 billion (AU$1.99 billion) within 12 hours, but broader data from CoinGlass showed total liquidations briefly topping US$2.5 billion (AU$3.83 billion), making the move the 10th-largest daily wipeout on record and still well below the October 10 crash, when more than US$19 billion (AU$29.1 billion) was erased in 24 hours.
With BTC/USD trading under the “true market mean” at US$80,700 (AU$123,471), traders are watching lower zones. One widely followed liquidity map flags US$74,400 (AU$113,832) and US$49,180 (AU$75,245) as key downside targets for the current bear phase.
Read more: Why 75% of APAC Investors Still Avoid Crypto: New Data Upends Adoption Myths